Life of a midPoint developer is a colorful one. There are enjoyable periods of building things when you have a luxury of undisturbed raising smaller or larger pieces of code. But sometimes there comes an interrupt: you break something in such a way that you are not able to find what is wrong – for hours or even for days, occasionally. Also regularly, after “feature freeze” points, there arrive periods of intensive and merciless hunting of remaining bugs. Besides this, often a colleague, customer, partner or a friend on the mailing list comes with a problem he or she urgently needs to help with.
The core of midPoint – IdM Model Subsystem – is an extremely powerful and flexible computation engine. It can be configured to implement almost all policies one could imagine. But with such flexibility comes potential (and sometimes very real) complexity: for more advanced configurations it is very easy to make a mistake that, with a bit of bad luck, manifests itself in a quite unexpected way.
When seeing undesired behavior the goal is simple: to determine whether it is caused by an external factor (wrong data, misbehavior of an external resource, slow mail server for outgoing notifications, and so on), by a misconfiguration (wrong mappings, roles, templates, correlation rules and the like), or even by a bug in midPoint or in one of connectors.
MidPoint has a very effective mechanism to facilitate this kind of problem analysis: elaborate logging. Because the full logging output is extremely verbose, there are guidelines how to successively enable more and more detailed logging output to diagnose a problem. This has a slight drawback, however: such diagnostic process is time consuming. You have to enable logging at coarse level and try the failed operation. Then inspect logs and (usually) find that you need more detailed logs. So you enable more detailed logging, and retry the operation. Then look at logs again. Get a suspicion but need some more information. So you enable even more details and … The situation becomes worse when the misbehavior is experienced by someone other than you. Each iteration has to be communicated. Your partner might be from the other side of the globe, introducing unnecessary delays into the process.
In such cases the only viable solution is to take the most detailed log possible, usually whole Model and possibly Provisioning set to TRACE level. And to keep a stiff upper lip and dig through tens or hundreds of thousands log lines. Gradually, one develops a set of sophisticated tricks enabling him to navigate through the log – from obvious search/search-previous/search-next functions, to writing custom marks or using bookmarking, to taking notes about timestamps, thread names, or OID-to-name mappings using paper and pencil, separate editor window or anything like that. More advanced users can even write simple or sophisticated scripts to process the log content.
Although helpful for one’s mental and memory capabilities and strong will, these practices are quite error prone and time consuming. Not once it happened to me that I’ve spend an hour hunting for a problem around lines 33592-38922 while the operation in question really started somewhere around line 244000 … you can imagine that.
During one such hopeless problem-tracking session an idea started to rise: is all this really necessary? Couldn’t we do any better? Having some experiences with writing Eclipse plugins I started writing one that could – at least – allow navigation through a large log file. So that one knows in what part of the log file he currently drills. The result seems to be quite encouraging:
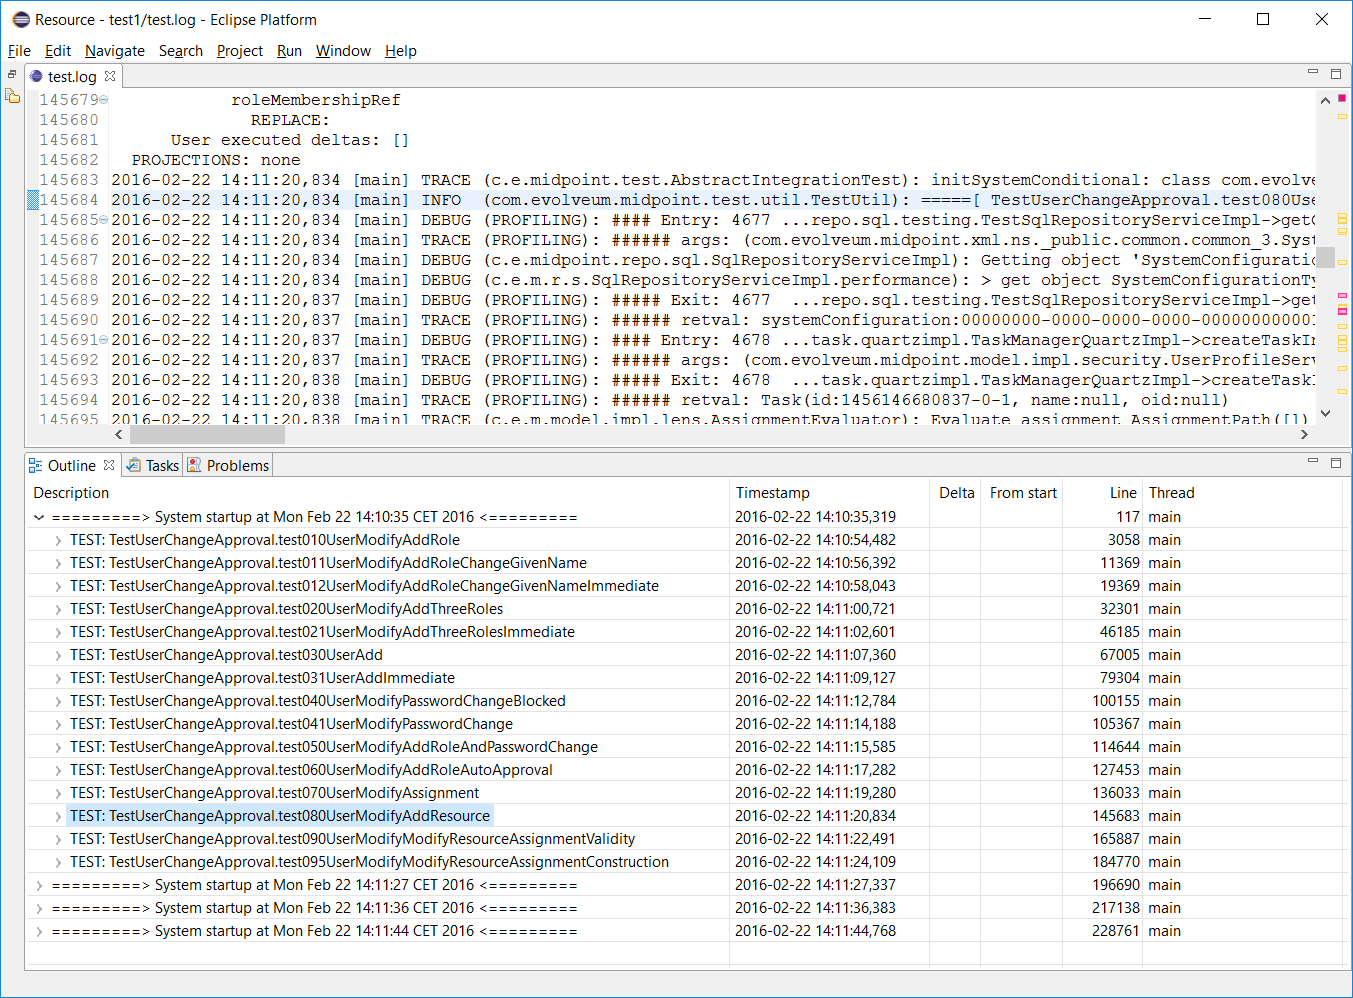
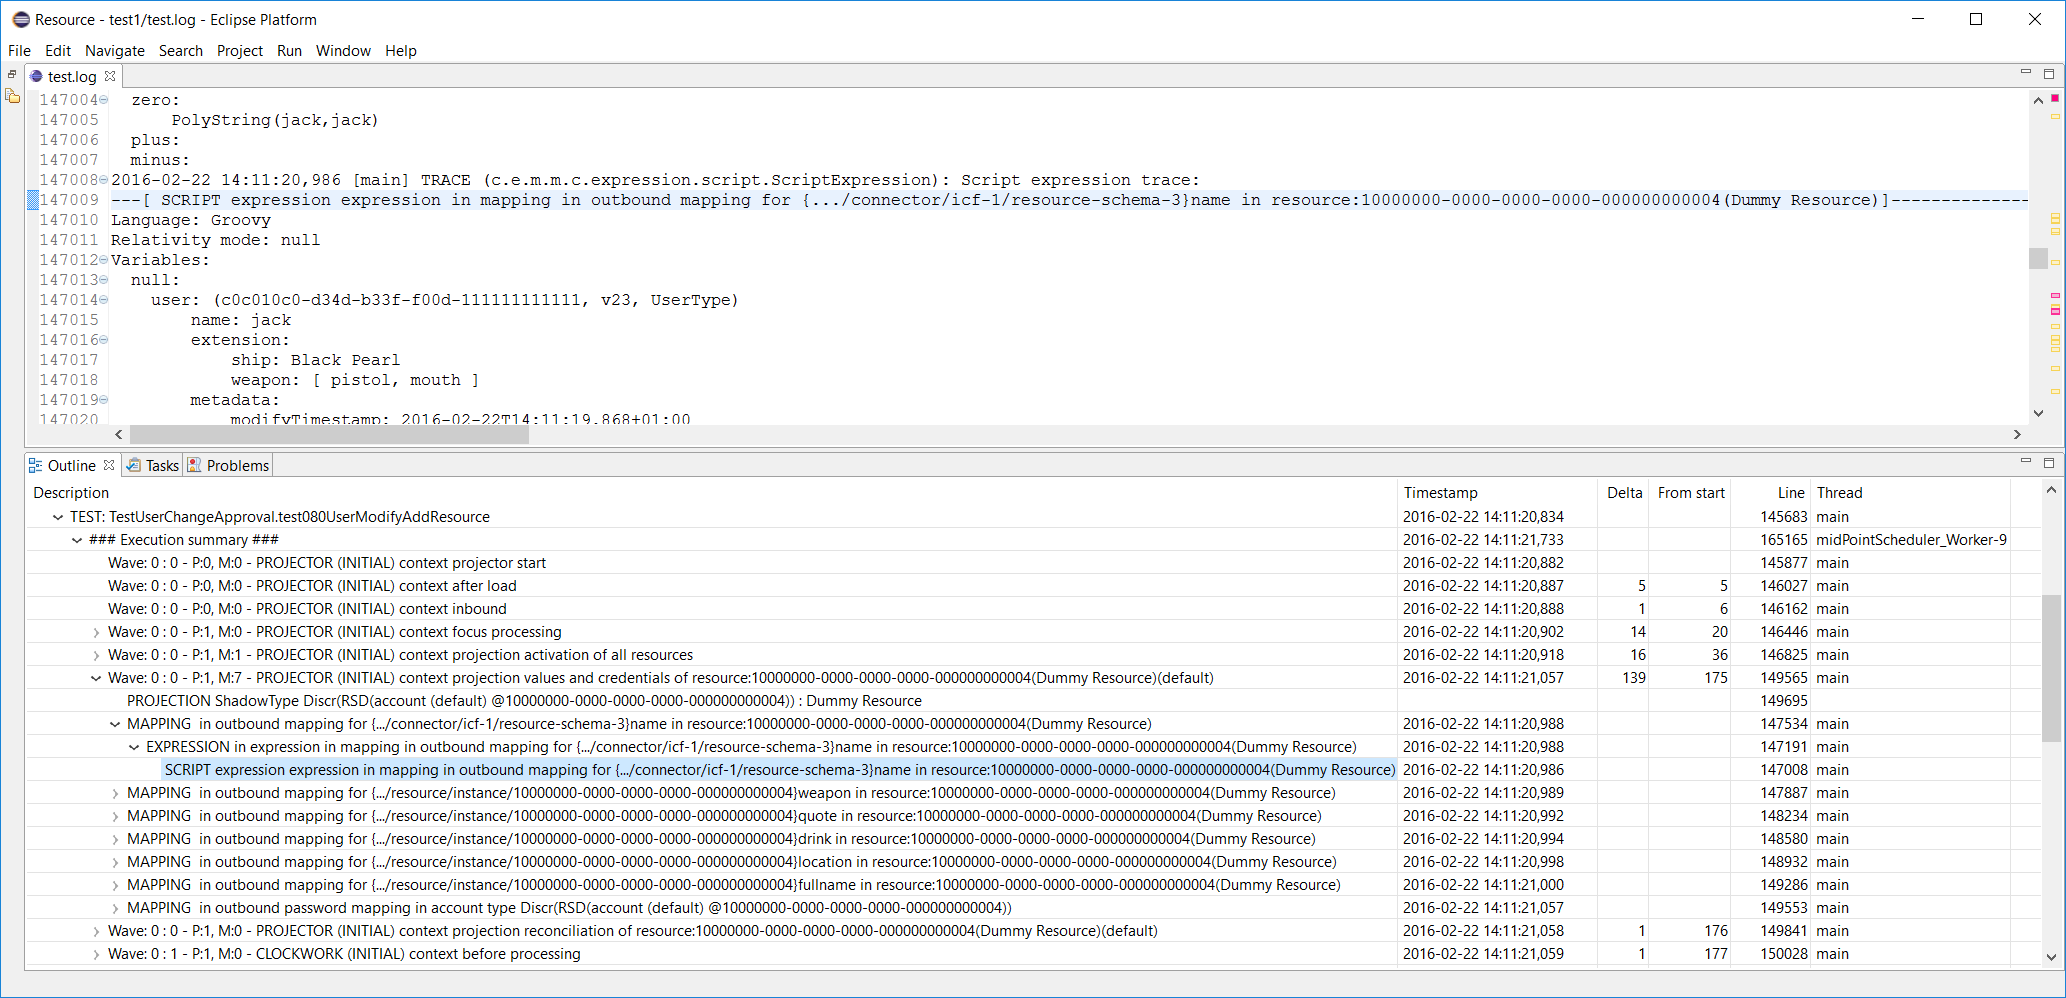
Now we shouldn’t be lost in the wrong system run, wrong test or wrong operation. All of these are shown in a tree-like outline. The outline can go deeper and deeper, down to individual operations, operation steps (projector steps and clockwork ticks), mapping, expression and script evaluations. Currently there are about 10 levels defined, and custom ones can be added. It looks like this:
A few days ago I got a log file from a partner that experienced very strange A device attached to the system is not functioning errors. (Warm thanks for explaining this error to matt.) I wanted to quickly see how many of these errors are there and to browse through them. However, there were 192 occurrences of “] ERROR (” string in the file, and 125 occurrences of “A device attached to the system is not functioning” string. Using three simple Log Viewer instructions to filter out irrelevant and duplicate occurrences I could come to the following list:

And then – of course – by clicking on particular error message the editor brought me to the exact place where the problem occurred.
Last year, when diagnosing some weird entitlement behavior in presence of rename operations I was lost in object OIDs. There were about 15 relevant OIDs – user, role and org objects, account and group shadows. My head was about to explode when trying to remember which one is which and to recognize them in the log. So the following features were added to the viewer.
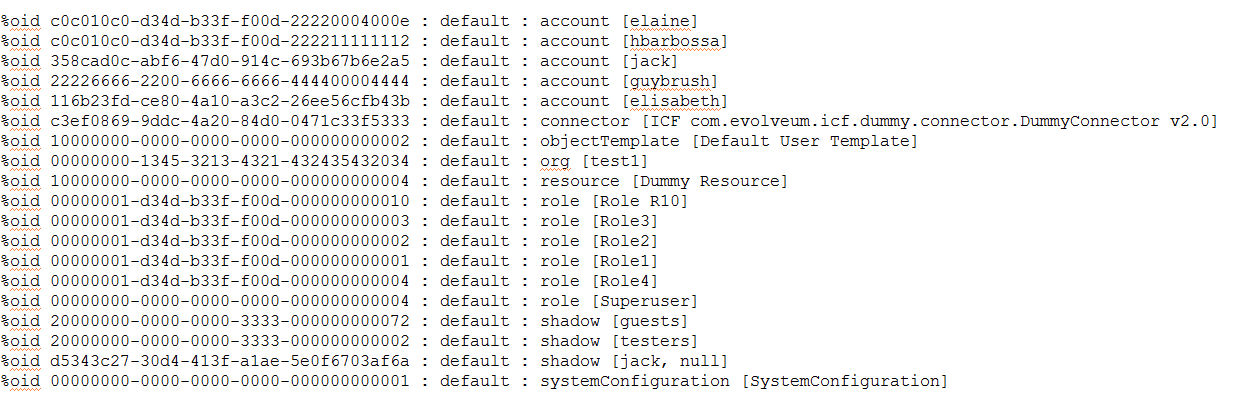
Discovery of OIDs and automatic creation of their dictionary:
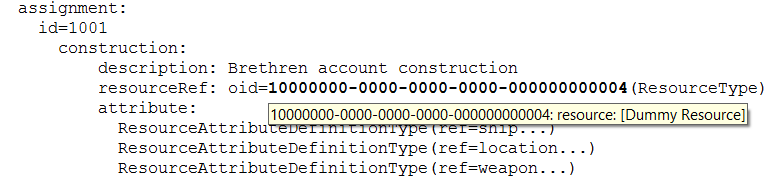
Ability to display object type and name by simply hovering cursor over the OID:
…and the ability to highlight selected OIDs with particular colors, to allow quick recognition of them in log texts:
To keep the story short, we will not describe all Log Viewer features here. Among those not mentioned there are:
showing basic performance information,
displaying customized lists of relevant lines,
selecting lines to be displayed in the outline e. g. to see only relevant threads,
folding (collapsing, expanding) of structured information at the level of log entries, profiling entries, and indented structures – in order to temporarily hide unimportant information,
reducing log file size by permanently removing specified lines or log entries.
Overall, this tool empowers one to fight with the overwhelming size of detailed midPoint logs by allowing to extract relevant information. Therefore, it is now possible to tell the colleague, partner, or customer “just set the tracing for model and provisioning to full and send me the logs; I will sort that out”, eliminating – or, at least, reducing – iterations in this process.
The tool is currently just a prototype. All configuration is done by inserting text instructions at the end of log file. Although a bit cumbersome, this was the easiest to implement, and can be efficiently managed e. g. by copying useful parts of configuration between log files. In the future, we plan to add GUI for most frequent actions like “focus on a given thread”, “show only error messages like this one” and so on. Also, not all functions are fully tested. Any bugs are fixed on the way. Finally, the tool requires a reasonably powerful machine (CPU + RAM). Recently I got i7-6700 with 16 GB RAM from my company 🙂 so it works very nicely on it. Everything depends on the size of the logs. For large logs and not-so-powerful machines Log Viewer contains the LogTrimmer command line tool to reduce logs before opening them in the viewer.
More information about the tool, including installation and usage instructions, can be found in the wiki.
As a conclusion, Log Viewer seems to be a relevant tool for offline diagnostics of problems related to midPoint configuration or code. Of course, it is not a universal log analysis tool for all situations and needs. It is oriented towards developers and advanced system administrators, who are searching for a cause of a specific undesired behavior. In addition to its development we are looking for complementary options in this area, covering e. g. day-to-day log aggregation and analysis activities.
And what about you? What tricks do you use to diagnose/debug your midPoint-related problems? Have you tried Log Viewer and what do you think of it? What other features of a good log analyzer/viewer would you regard as useful? Please tell us in the comments below.